As the demand for moments has continued to rise over the last few months, Top Shot has done its part to slowly rev up the supply side of things. In its most recent change, Top Shot has more than doubled the circulation count of its latest Series 2 Base Set moments — cranking that count all the way up to 35,000.
While only a percentage of these moments have been released in packs, there’s still plenty marketplace activity for us to study and learn from. Analyzing the new kids on the block is mildly interesting, but as always, things get spicy as we make comparisons to previously released moments and draw some surprisingly conclusions. Let’s dive in.
1. The Moment Matters
Spending hours poring over marketplace transaction data (just me?), it’s easy to treat these moments as only numbers and names in a spreadsheet and forget about the in-game moments that make them so special. If we ignore this aspect of a moment, we can leave ourselves blind as to why the marketplace is behaving in a seemingly bizarre way.
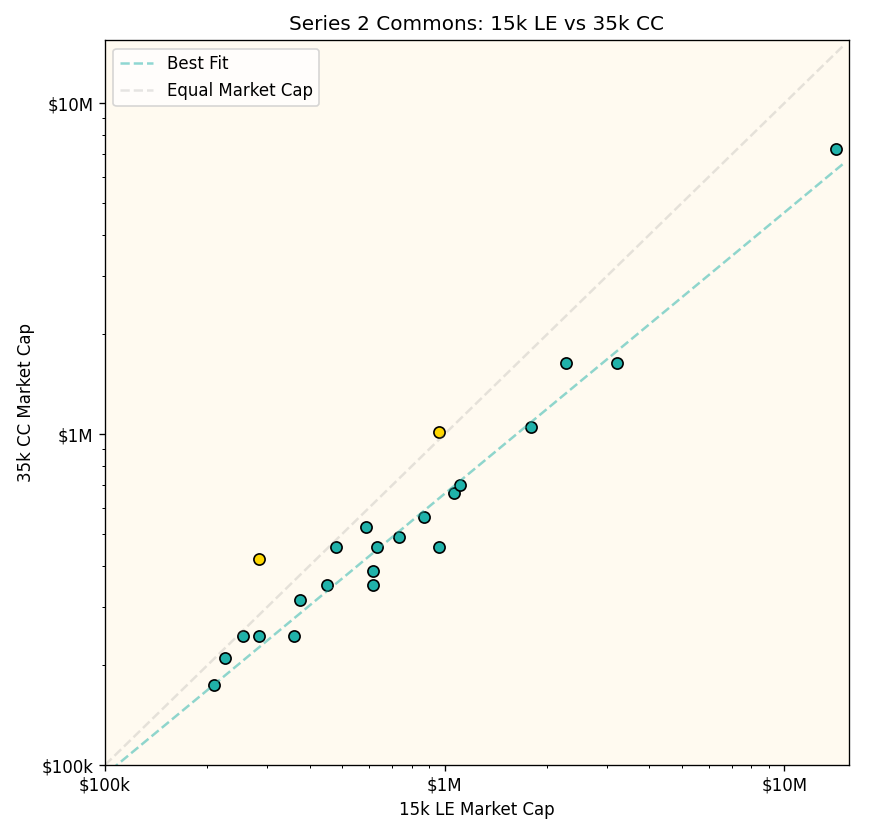
To see this in action, let’s start by finding all of the Series 2 Base Moments that have been minted in both 15k and 35k circulation counts and calculating their respective market cap values.
As usual, we’ve drawn a grey reference line that indicates an equal market cap between a player’s 15k and 35k Series 2 moments. Right away we can see that there appears to be a clear trend that a player’s 15k LE moment garners a higher market cap value than their 35k CC variety. But there are two notable exceptions: Miles Bridges and Damian Lillard. Why is that?
Both of these moments come from exciting plays that encapsulate the signature style of each player. In Bridges’ case, this moment starts with a fast break behind-the-back pass from Rookie of the Year frontrunner LaMelo Ball, and ends with a windmill dunk in traffic. Absolutely filthy. In Lillard’s case, it’s no surprise that this moment is a buzzer-beating, step-back game winner. Dame time, anyone? It’s refreshing to see that the data backs up the idea that a better moment garners a higher price tag.
2. Predicting Challenge Depreciation
Setting aside these two outliers, there’s a clear relationship between the value of 15k LE and 35k CC moments. And to better understand this trend, we can start by fitting a curve to the data:
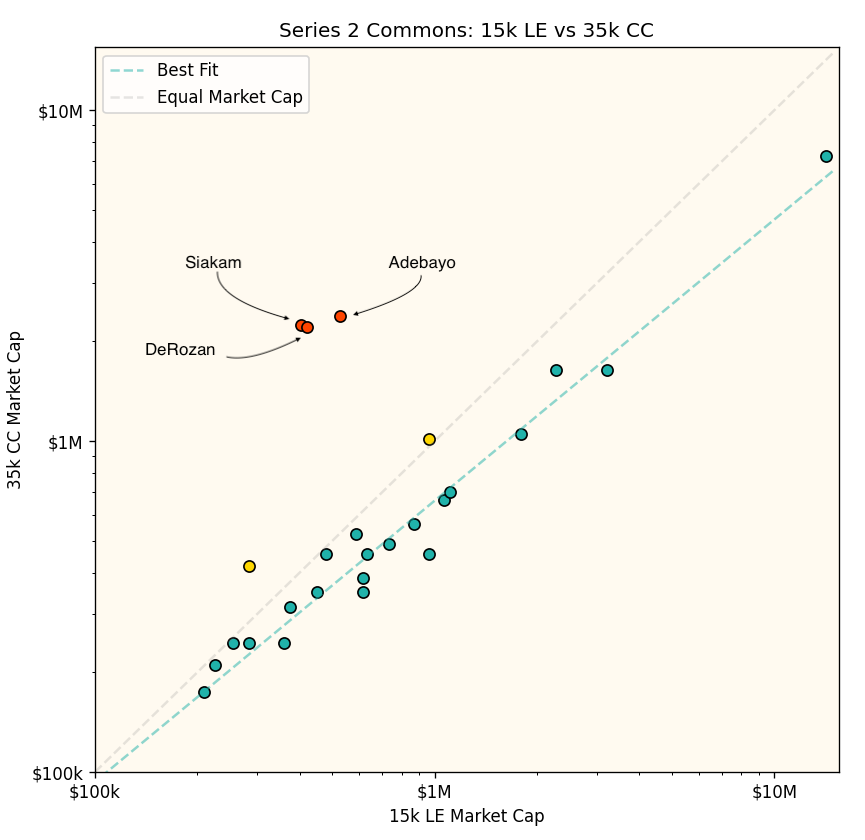
This curve represents the general trend in the data, and we can use it make predictions on other data points, such as the moments required in the Mike Conley Challenge. Let’s go ahead and find the Challenge moments from players with both 15k LE and 35k CC moments so we can see what we’re working with.
Right away, we see just how much utility is baked into these three moments. When the Challenge comes to a close, these moments’ prices will certainly come crashing down, and so the question becomes, how much? If we can accurately predict their post-challenge value, we can make much smarter decisions about partaking in the challenge.
Since these players have a 15k LE moment to serve as a reference point, in order to estimate their post-challenge value, all we have to do is find their position on the best-fit curve given their 15k LE market cap. Visually, we can imagine each of these three red points to falling straight down until they land on our best-fit curve. Crunching the numbers, we find the following market cap values:
Bam Adebayo: $382k
DeMar DeRozan: $316k
Pascal Siakam: $306k
To calculate the lowest asking price based on these market cap values, all we have to do is divide by the circulation count —35,000. We’re now left with the following low prices:
Bam Adebayo: $10.92
DeMar DeRozan: $9.03
Pascal Siakam: $8.75
This definitely passes a quick sanity check, and on average represents a depreciation of a whopping 85%! While we can’t predict the depreciation of the other two challenge moments (KAT and Oladipo) with this exact same method, we can likely assume that they will follow a similar trajectory and depreciate a similar amount.
3. More Accessible ≠ Higher Value
In a previous article, we saw how Series 1 MGLE moments exhibited a lower market cap value than their Base Moment counterparts, and this was chalked up to accessibility. Simply put, the idea was that these cheaper Base Moments are more aligned with the dollar amount a Top Shot user is willing to invest in a single moment, which in turn leads to increased demand and increased price. But this hypothesis doesn’t hold true when comparing our Series 2 Base Set moments.
As an example, let’s take a look at Devin Booker’s Series 2 Base Moments with 15k and 35k circulation counts:
Doing the math, the market cap is $825k for the 15k LE moment, and $595k for the 35k CC moment. This goes against our previous hypothesis, so let’s pull in some additional data around user marketplace behavior. Here we can see the percentage of purchasing Top Shot users that have spent X dollars on a single moment.
While there’s a noticeable drop-off, there isn’t a drastic different between those willing to spend $17, and those willing to spend $55. We see that 89% of purchasing Top Shot users have spent at least $17 on a single moment, and 73% have spent at least $55.
It looks to me that since both the 15k LE and 35k CC moments are within reach for a large percentage of purchasers, most users are more interested in spending the extra Dapper dollars for a Limited Edition moment with a significantly lower circulation count. Another hypothesis is that users are concerned with the fact that Top Shot could mint more than the listed 35,000 moments. If this were to occur, individual moment value would become diluted, and prices would likely fall.
It will be interesting to see how this shakes out, but one can assume that this trend will only strengthen over time. As more 35k CC moments are released in packs, the supply will continue to increase, likely driving down the price if the demand doesn’t make a drastic change.
That’s all for this week! If you’re enjoying this content and want to support Minted Moment, the best way you can help out is by sharing with a friend.


Amazing article. Love the scientific method to the research.
Your extensive use of Market cap in your analyses lends to the necessity for accuracy of this figure. However, I don't think your definition of market cap is very accurate. Sometimes when you apply the same definition (such as market cap) broadly across a population, you can expect the resulting data comparisons to be relatively accurate, but not necessarily absolutely accurate. However, when you take the product of the lowest for sale price and the moment population, the resulting market cap can swing wildly intraday as the lowest for sale price changes. There are many reasons for why a seller would pick a low price, or try to get a higher price, but your market cap definition does not attempt to account for minimum sales price inconsistencies or variations in seller motivation. Generally, the market cap is equal to the product of the share price and the number of outstanding shares. In the stock market it's easy because all the shares have the same value. It seems as though you use this simple definition incorrectly in Top Shots since each share price (i.e. moment) does not have equal value (lower serial numbers generally have higher value, as you've noted). Thus the true market cap is the sum of what each moment would sell for in the open market. Of course, this cannot be calculated without taking liberal assumptions (since not all serial numbers are for sale for a given moment), but we can employ other statistical methodologies to approximate the market value of the moments given those that are for sale. Perhaps taking the simple mean (or median) for sale price multiplied by the total number of serial numbers is a better approximation of market cap. Or perhaps you can apply your "Better Value Strategy" to remove the outlier for sale prices, and then apply an averaging methodology to find the better market cap? I'm not a statistician, so I'm sure there are many more elegant ways to model the data to improve the accuracy of the market cap metric for the purposes of your analyses.