Every summer, sixty of the best athletes in the world hear their name called during the NBA Draft. It’s a chance for each franchise to find the player that will take them to the next level, and as a fan, you can’t help but have high expectations for your team’s rookies, hoping they pan out to be superstars.
With every passing game we have more data that can help us speculate rookies’ future success in the NBA, and with more than half of the 2020-21 season in the rear view mirror, what have we learned? How are our coveted, tripled-badged-up rookies faring? Let’s dive in.
The Reality: Short Careers
There’s a reason the NBA is the best basketball league on the planet - the game is chock-full with the best athletes from their own draft classes, players who have been sharpening their skills at the NBA level for years on end. If making it to the NBA is incredibly challenging, having a lasting career is even more mind-boggling.
While some Top Shot rookies have already dazzled us with spectacular highlights and poster dunks (can we still call them that?), some haven’t quite found their stride in the League. Without a doubt, some of this year’s rookies will unfortunately be out of the NBA within a handful of years. To try and better understand how many this might be, let’s study some historical data.
We can start by taking the careers of all rookies drafted between 2011 and 2016, and analyzing whether or not they were active NBA players five years later. To better compare rookies, we can also separate first-round from second-round draft picks.
Right away, we can see a clear delineation between our first-rounders from our second-rounders. For our first-rounders, roughly 70% are active NBA players five years after their rookie season. For their second-round counterparts, just over half are in the League just after their rookie season, and this number drops to 26% by year five.
For this reason, I’d proceed with caution before taking on a long-term strategy and investing heavily in second-round draft picks that have had a bumpy start to their rookie season. We obviously cannot jump to conclusions on draft pick alone (Jokic was drafted with the 41st pick in the 2nd round!), so let’s take a closer look at analyzing the stats this year’s rookies are putting up.
Finding Similar Players
To some extent, we don’t expect rookies to hit their true potential during their first season in the league. It’s one of the reasons why LaMelo Ball’s stat line of 16 PTS, 6 REB, 6 AST is so impressive, and has drawn so much attention. Before we compare rookie stat lines to established NBA players, we ought to consider how they stack up to rookie seasons from the past.
Let’s start with a simple example: what historical rookie seasons are most similar to LaMelo Ball’s? To answer this question we’ll use a simple Machine Learning algorithm called K-Nearest Neighbors. Don’t let the name scare you, as it’s quite straightforward. To illustrate how this algorithm works, let’s consider only two stats from each rookie’s debut season: points and assists. Here’s a scatter plot showing these stats for all rookies over the previous 10 seasons:
Right away we can see that it’s really special when a rookie can both score and create shots for their teammates - the upper-right section of this chart is rather sparse. To find the most similar players to a given rookie, all we have to do is place them on this chart, and find the nearest players. Let’s go ahead and put LaMelo on our chart:
Funny enough, we can see that the player with the most similar rookie numbers for points and assists is Michael Carter-Williams (2014 Rookie of the Year). While this might scare you at first, we can see that Lamelo is in some special territory with Damian Lillard, Kyrie Irving, and Ja Morant all sitting nearby. In general, we can find the K nearest players, and draw some conclusions based on their respective NBA careers. Let’s combine this approach with the NBA lifespan data from earlier to project how long this year’s rookies may be in the League.
Projecting NBA Lifespans
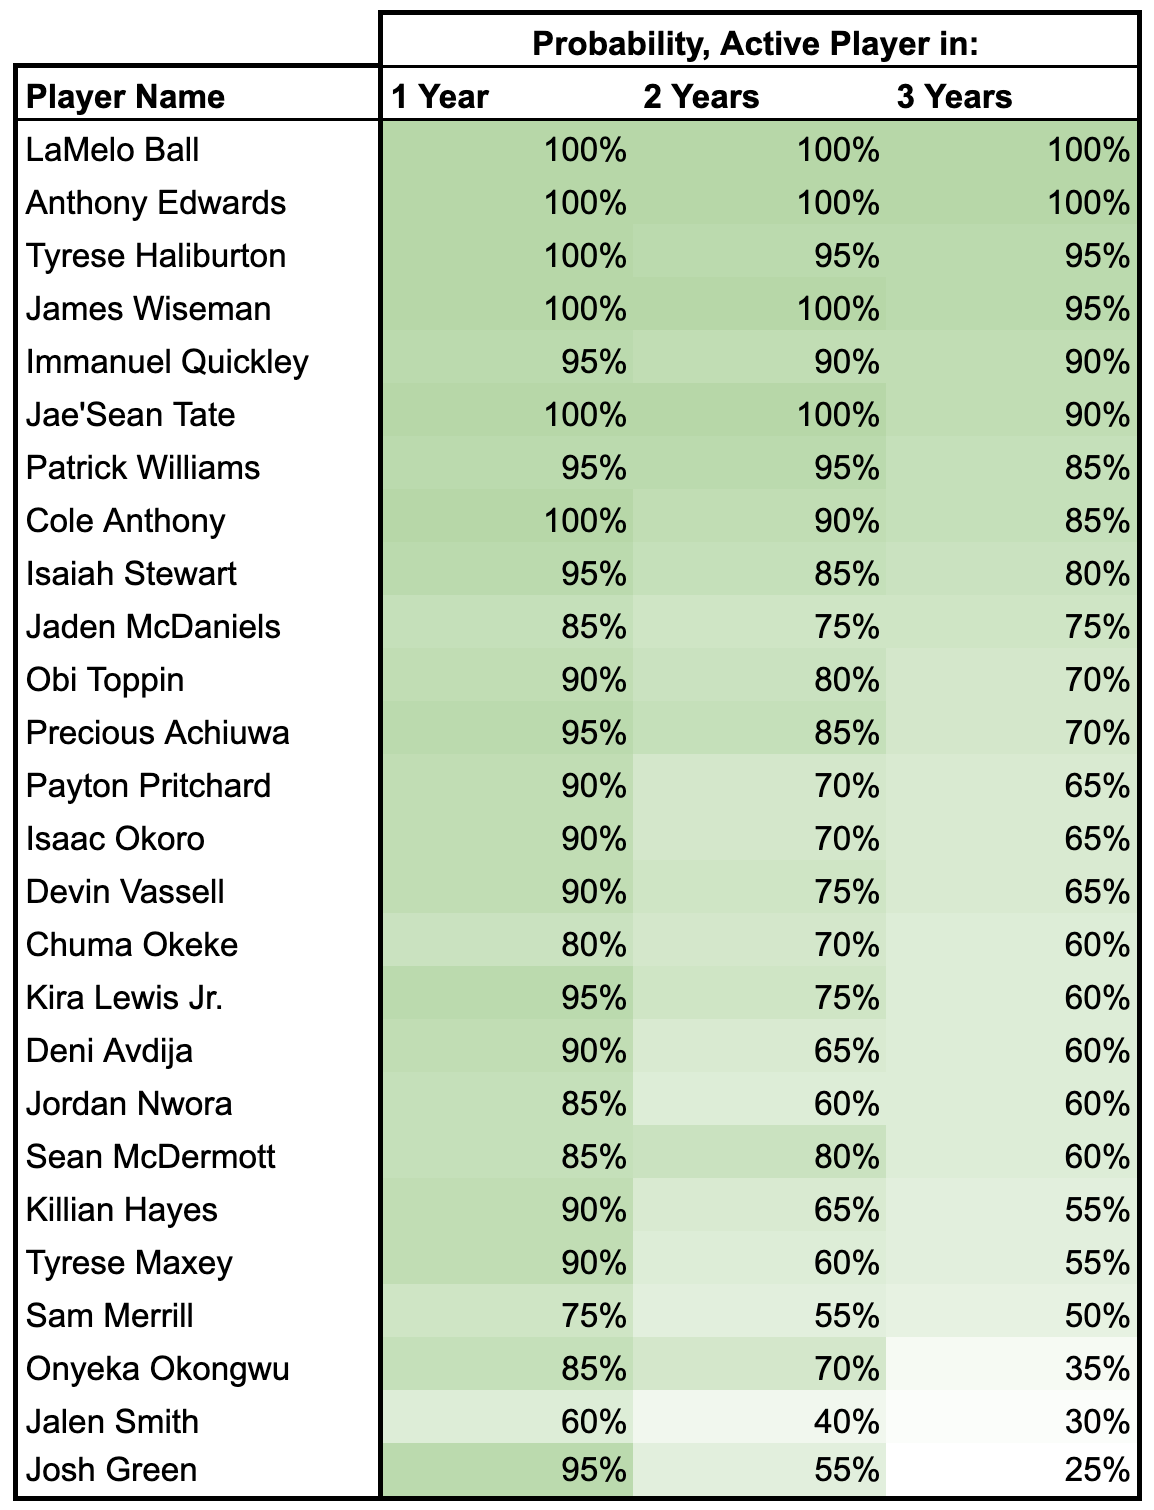
To project the NBA career lengths of this year’s rookies, we can find the 20-most similar rookies from the 2011-2018 seasons based on points, rebounds, and assists, and analyze the percentage of them in the league one, two, and three years after they entered the league.
So how can we interpret this data? Let’s Take Sam Merrill as an example. This season, Merrill is averaging 2.8 PTS, 1.0 REB, 0.8 AST per game. If we take these rookie numbers, and find the 20 most similar rookie seasons from the past, 50% of these players were out of the NBA by the third year after they entered the league
Not surprisingly, the top players from this year’s class are putting up great numbers, and they’re seemingly guaranteed to be in the league over the next handful of years. For some of the other players, they may need to turn things around if they plan to be in the league over the next few seasons.
Comparing Market Value
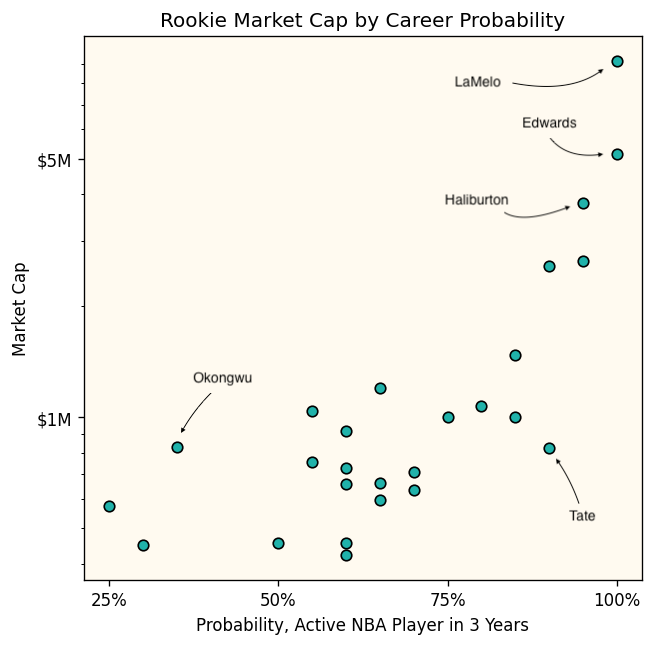
These projections are interesting, but how do they relate to player value on Top Shot? Let’s start by combining this career projection data with Top Shot market cap values. To better visualize this relationship, consider this chart:
Not surprisingly, the rookies with strong projections (LaMelo, Edwards, Haliburton) have higher price tags on the marketplace - they’re putting up impressive numbers. Interestingly, we can see how the market has collectively established market cap values inline with players’ career projections.
I highlighted two players that caught my eye: Houston’s Jae’Sean Tate, and Atlanta’s Onyeka Okongwu. Both players have similar Top Shot market cap values ($824k and $832k, respectively), yet they have noticeably different stat lines:
Tate: 10.6 PTS | 5.5 REB | 1.8 AST
Okongwu: 2.6 PTS | 2.2 REB | 0.2 AST
Why might this be the case? Perhaps the market is discounting Tate’s rookie season, as he’s taken on an increased role on a rebuilding Houston team. Alternatively, the market may be bullish on Okongwu’s potential as he continues to get his footing in the NBA and catch more lobs from Trae Young. We can never pinpoint exactly why the Top Shot market behaves the way it does, but we can always analyze the data to better understand it.
If you’d like to play with this rookie data yourself, feel free to take it for a spin and download it here. That’s all for this week! I hope you enjoyed this rookie deep dive, and if you’re enjoying this content, the best way you can help out is by sharing with a friend.


Tate is 25, Okongwu is 20. I wonder what the trend line would look like if you added age as a variable. Great post!
I like to compare the number of moments currently circulating too. So when looking at Tate vs Okongwu, Tate's moment has 3X more circulating today while most of Okongwu's hasn't been released in packs yet. My prediction is Okongwu's value will drop as his moments are released.